About the Port's Greenhouse Gas Emissions Inventories
The Port conducts two separate greenhouse gas (GHG) emissions inventories: one for GHG emissions associated with the Seattle-Tacoma International Airport (SEA) and the other for GHG emissions from its maritime-related sources, which include the Port's Maritime and Economic Development Divisions' lines of business, separate from SEA. Both Port inventories follow the GHG Protocol Corporate Accounting and Reporting Standard to estimate Scope 1, Scope 2, and Scope 3 emissions, which represent sources directly and indirectly controlled or under some degree of Port influence.
Inventories track progress toward the Port's Century Agenda GHG reduction targets. In October 2021, the Port updated its GHG targets to accelerate Scope 1 & 2 reductions to ‘net zero or better by 2040’ from ‘carbon neutral or negative by 2050’, and increased ambition of its Scope 3 reductions to ‘carbon neutral or better’ by 2050 from ‘80 percent’. The updated targets respond to the urgency of the climate crisis, build on reduction initiatives already underway, and affirm Port leadership to facilitate the clean energy transition and zero-emission port operations.
| Scopes 1 and 2 | Scope 3 |
|---|---|
| Port-controlled and Port indirect emissions | Emissions the Port has influence over but not direct control |
|
|
(1) Net-zero means any carbon dioxide released into the atmosphere from a company’s activities is balanced by an equivalent amount being removed
(2) Carbon neutral or carbon negative means emissions can be offset with a reduction that could include buying carbon offsets to make up the difference
Port of Seattle conducts GHG emissions inventories annually for the previous calendar year, which are publicly released once the emissions calculations are complete. The SEA and Maritime GHG Inventory is verified by The Climate Registry (TCR) for Scope 1&2 (TCR - POS Inventory) while the SEA Inventory is additionally verified for all three scopes through the Airport Carbon Accreditation Program. The Port is committed to data accuracy and transparency and the inventories represent a best estimate of emissions sources. As new information or inventory best practices become available, the Port may update historical data or inventory methods to better reflect its sources and their contributions.
Port-Wide Greenhouse Gas Emissions
Scope 1 and 2 GHG Emissions
Scope 1 and 2 emissions include direct emissions from sources under the Port's control (scope 1) or indirect emissions produced to generate the electricity used by the Port (scope 2). The Port conducts inventories for Scope 1 and 2 emissions annually.
| Scope 1 Sources | Scope 2 Sources |
|---|---|
|
|
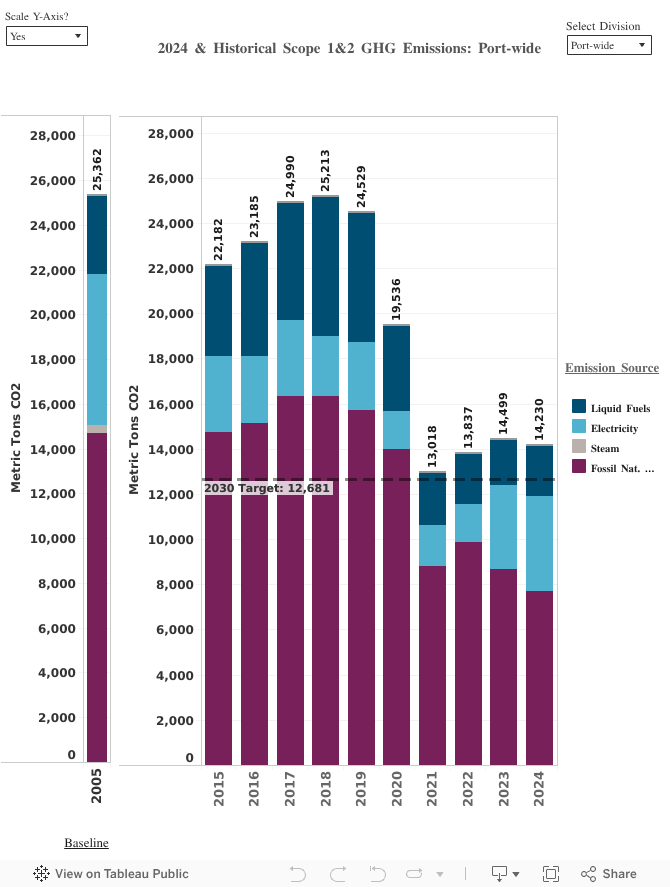
Scope 1 & 2 Trends
As of the 2024 GHG Inventory, the Port achieved a 44 percent reduction in Scope 1 & 2 GHG across all of its operations from the 2005 baseline.
Aviation Scope 1 and 2 Details
Airport operations make up most of the Port's Scope 1 & 2 GHG emissions, and SEA achieved a 41 percent reduction from 2005 as of the 2024 GHG Inventory. In 2021, The Aviation Division became the first major operating division to meet the Port’s ambitious goal to reduce owned and controlled emissions by 50 percent by 2030. However, in recent years, the Aviation Division has fallen short of a 50 percent reduction due to higher carbon intensity from electrical power. The Port calculates GHG emissions from electricity using GHG emissions factors provided by local utilities. The emissions factor changes year to year based on the energy mix used in electricity generation. 2023 and 2024 saw a decrease in hydropower availability, which increased the carbon intensity of purchased electricity.
Drivers of the reduction in Scope 1&2 GHG emissions from the 2005 baseline for the Aviation Division include:
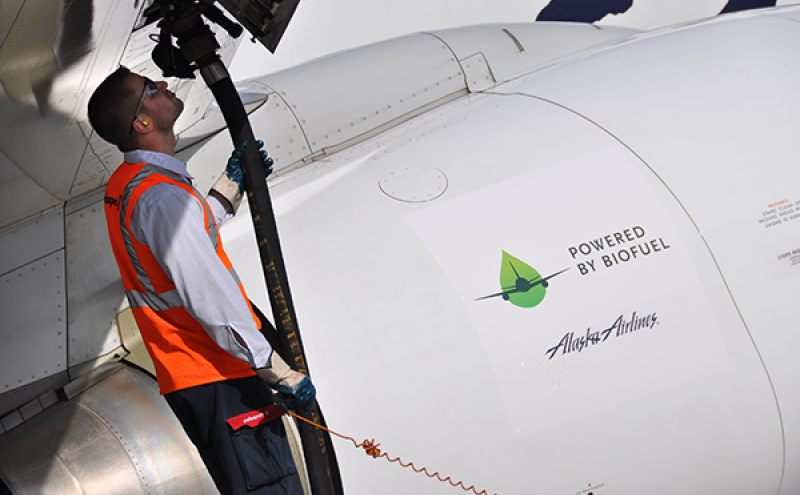
- Replaced fossil natural gas with renewable natural gas in our boilers, Puget Sound Energy (PSE)-served buildings, and in the SEA bus fleet.
- Continued use of renewable diesel in port-owned fleet vehicles and equipment.
- Purchased PSE Green Direct wind electricity for buildings on the south end of SEA.
Maritime Scope 1 and 2 Details
In 2024, the Maritime and Economic Development Divisions saw a 72 percent reduction in Scope 1&2 GHG emissions, driven largely by continued purchasing of renewable natural gas in all buildings serving these divisions, which began in 2023.
Drivers of the reduction in Scope 1&2 GHG emissions for the Maritime and Economic Development Divisions include:
- Purchasing renewable natural gas to replace all fossil natural gas in Maritime and Economic Development buildings.
- Continued use of renewable diesel in Port fleet vehicles and equipment.
Port of Seattle Scope 1 and 2 GHG Emissions Data
- SEA Airport Scope 1 and 2 Emissions Inventory Data (2023) [2024 coming soon!]
- Port of Seattle Maritime Scope 1 and 2 Emissions Inventory Data (2023) Scope 3 GHG Emissions [2024 coming soon!]
Scope 3 GHG emissions are indirect sources of emissions that are a consequence of the Port's activity but are owned or controlled by another entity. Scope 3 emissions sources include energy used by Port tenants, airplanes, ground transportation to and from the airport, cruise ships and other ocean-going vessels, cargo-handling equipment, rail locomotives, waste transport and disposal, employee business travel by air, and even Port employees commuting to and from work.
Scope 3 Trends
In 2023, Scope 3 emissions for Aviation were 9% higher compared to the 2005 baseline. While the COVID-19 pandemic caused a sharp decline in air travel in 2020, leading to a significant drop in emissions, they have been steadily increasing as air travel and related services recover. However, emissions remain below pre-pandemic levels. This is due to factors such as the increasing electrification of ground vehicles, including curbside and Transportation Network Company (TNC) fleets like Uber and Lyft, as well as improved use of the pre-conditioned air system, which has reduced emissions from aircraft auxiliary power units (APUs).
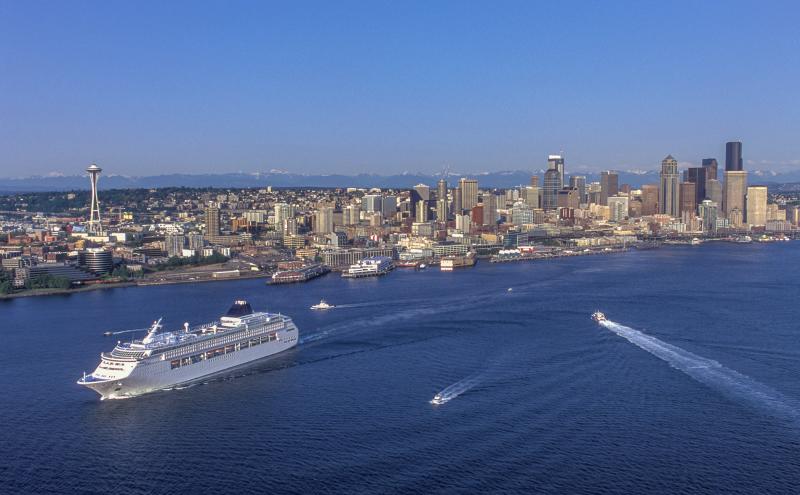
Maritime-related Scope 3 emissions have increased 31% since the first PSEI in 2005, as of 2021/2022. This increase was largely driven by growth in the Port's cruise business since 2005.
The Port's Maritime Scope 3 GHG emissions data primarily comes from the the Puget Sound Maritime Air Emissions Inventory (PSEI). The PSEI is conducted every 5 years and measures criteria air pollutant and GHG emissions associated with all maritime-related activities in the Puget Sound region. The sources covered for Port of Seattle include ocean-going vessels, commercial harbor vessels, recreational vessels, locomotives, cargo-handling equipment, cruise buses on terminals. Emissions are measured for the full airshed, which extends out to the U.S. border for vessels traveling through Puget Sound. The latest PSEI includes air and GHG emissions data for 2021. The Port also completed an inventory for cruise ship emissions in 2022 as 2021 saw a lower-activity cruise season as the industry returned after the onset of COVID-19. For this reason, the Port's Maritime Scope 3 totals include 2021 GHG data for grain ships, harbor and recreational vessels, cargo-handling equipment, and cruise buses, and 2022 GHG data for cruise ship activity.
Port of Seattle Scope 3 GHG Emissions Data
- SEA Airport Scope 3 Emissions Inventory Data (2023)
- Port of Seattle Maritime Scope 3 Emissions Inventory Data*
*Note: Data on GHG emissions from maritime supply chain (ocean-going vessels, commercial harbor vessels, recreational vessels, locomotives, cargo-handling equipment, cruise buses on terminals) comes from the Puget Sound Maritime Air Emissions Inventory. Completion of this inventory occurs every 5 years. The Maritime Supply Chain emissions for 2022/2023 were calculated using a mix of 2021 Puget Sound Emissions Inventory results and a supplemental inventory of cruise ship activity for the 2022 cruise season.