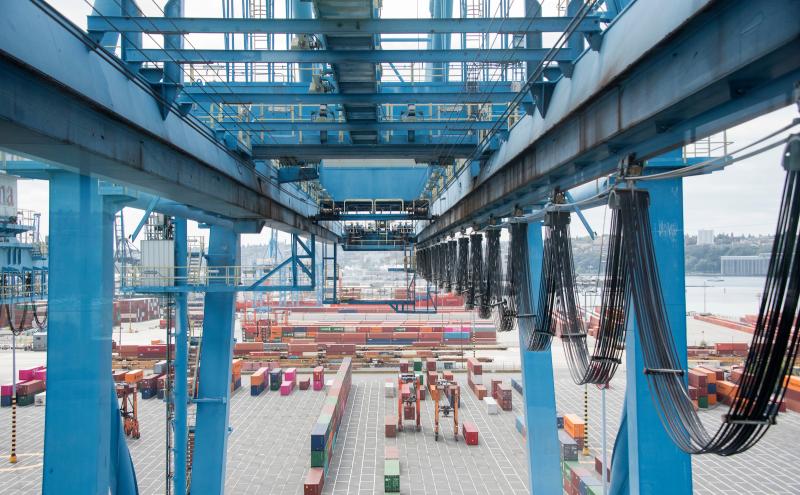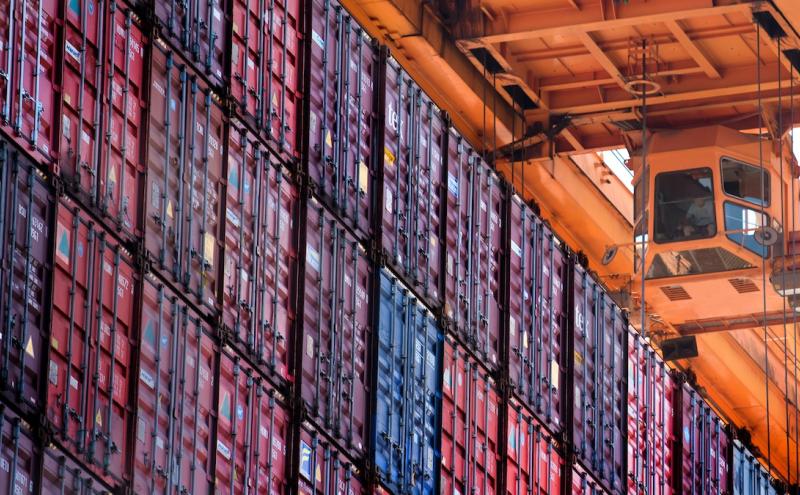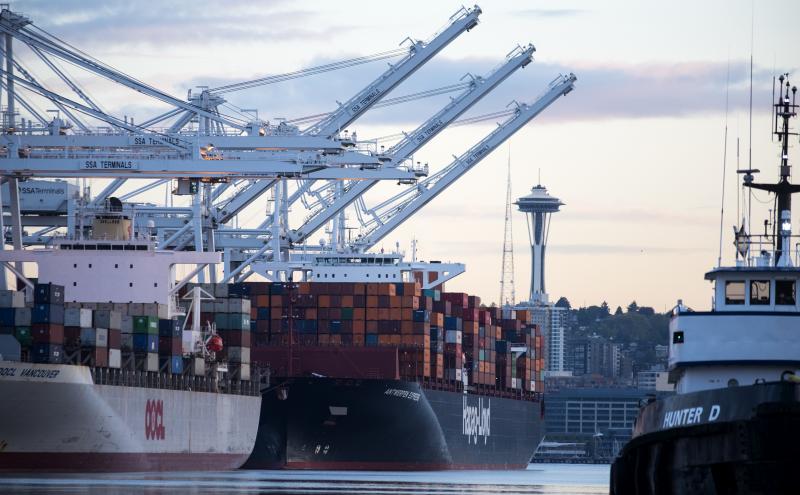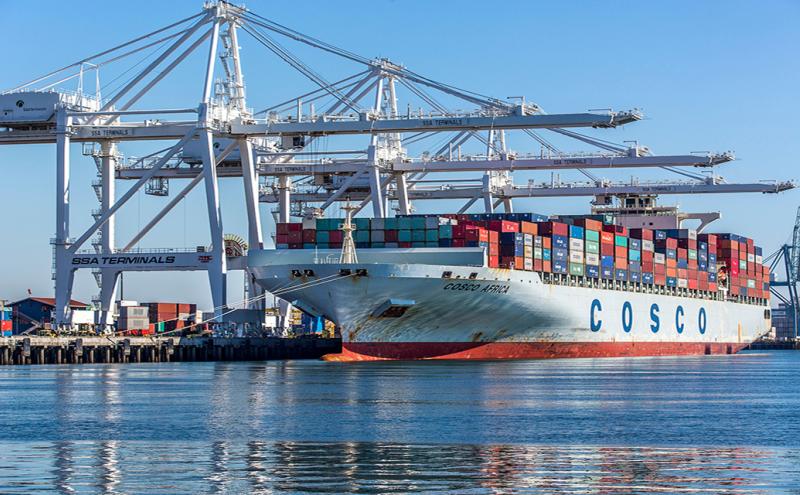
Cargo operations in our region are managed by The Northwest Seaport Alliance (NWSA), which jointly operates the Ports of Seattle and Tacoma. On Mondays, the NWSA publishes a weekly update of its volumes and metrics for both ports.
The updates below include both the North Harbor (Seattle) and South Harbor (Tacoma) for the Northwest Seaport Alliance (NWSA).
Weekly Updates
Week of July 7
Source: Northwest Seaport Alliance
Preliminary data indicates that the week ending in July 11, saw one increase, one decrease, and one metric with mixed results from the previous week. International imports jumped 62.7% from the week before, largely due to the no blanks and the two vessels that were delayed from the week before being counted. Imports were also up 7.9% compared to the July 2024 weekly average and 17.6% compared to the weekly average to date.
- Follow the detailed weekly update on the Northwest Seaport Alliance website
- Reference a full vessel schedule and four week lookahead
A new regional economic impact analysis shows The Northwest Seaport Alliance (NWSA), the Port of Tacoma, and the Port of Seattle continue to be primary drivers of the regional and state economy, supporting more than 265,000 jobs in 2023. Together, the organizations generated $17.7 billion in wages and benefits and nearly $55 billion in business output.
The report offers a comprehensive, regional look across the Seattle-Tacoma gateway including marine cargo, aviation, real estate, commercial fishing, and the cruise industry. This is the first time that all lines of business have been evaluated together.
Weekly Vessel Arrival Snapshot
Week ending July 18
Source: Marine Exchange of Puget Sound
| CATEGORY | LAST WEEK | THIS WEEK | % CHANGE |
| Bulk | 8 | 4 | -50% |
| Container | 11 | 15 | 36% |
| General | 1 | 1 | 0% |
| Other | 1 | 3 | 200% |
| Passenger | 14 | 13 | -7% |
| Ro/Ro | 3 | 2 | -33% |
| Tanker | 13 | 12 | -8% |
| Tug/ATB | 3 | 3 | 0% |
| Vehicles | 5 | 8 | 60% |
| 58 | 59 | 2% |
Weekly Vessel Calls
Source: Northwest Seaport Alliance
| Week Ending | Voyages | Blank Sailings+ |
| July 25 | 12 | 2 |
| July 18 | 13 | 0 |
| July 11 | 13 | 0 |
| July 4 | 9 | 2 |
| June 27 | 13 | 0 |
| June 20 | 12 | 1 |
| June 13 | 12 | 2 |
| June 6 | 12 | 1 |
| May 30 | 13 | 2 |
| May 23 | 13 | 1 |
| May 16 | 12 | 2 |
| May 9 | 12 | 1 |
| April 25 | 13 | 2 |
+ A "void sailing," also known as a "blank sailing," refers to a scheduled cargo ship service that skips a port or region it was supposed to visit.
Vessels: Year over Year Change
Source: Marine Exchange of Puget Sound
May 1-23
Monthly comparisons to same time last year for Seattle and Tacoma
| TYPE | 2024 | 2025 |
| Bulk | 9 | 9 |
| Container | 18 | 20 |
| General | 3 | 2 |
| Other | 2 | 0 |
| Passenger | 26 | 29 |
| Tanker | 0 | 2 |
| Tug/ATB | 0 | 2 |
| Vehicles | 1 | 0 |
- For vessels coming into Seattle, see the Ship Sightings page
2025 International Container Volumes (imports and exports)
Source: Northwest Seaport Alliance
- Bold = highest
- Italics = lowest
| Month | Imports (in TEUs) | Exports (in TEUs) |
| December | ||
| November | ||
| October | ||
| Q4 2025 | ||
| September | ||
| August | ||
| July | ||
| Q3 2025 | ||
| June | ||
| May | 90,776 | 92,821 |
| April | 109,481 | 103,903 |
| Q2 2025 | ||
| March | 115,813 | 126,993 |
| February | 108,883 | 97,788 |
| January | 116,916 | 99,392 |
| Q1 2025 | Up 23.9% with higher empty sailings at -9.8% |
Up 24.5% |
- For more detailed information, check the Northwest Seaport Alliance website.
10-Year Historical Context
Source: Northwest Seaport Alliance
Below, you’ll find historical context for the last ten years in international container volumes (imports + exports + empty) by TEUs.
What’s a TEU?: The TEU stands for 20-foot equivalent unit, a standard that can be used to measure a ship’s cargo capacity. One TEU is 20 feet long and 8 feet tall.
- Bold = highest
- Italics = lowest
| Year | Imports | Exports | Empty |
| 2024 | 1,289,198 | 636,507 | 684,540 |
| 2023 | 1,078,005 | 588,744 | 570,018 |
| 2022 COVID-19 | 1,249,746 | 561,244 | 838,552 |
| 2021 COVID-19 | 1,464,662 | 691,446 | 836,012 |
| 2020 COVID-19 | 1,253,818 | 790,620 | 591,198 |
| 2019 | 1,369,251 | 913,332 | 775,763 |
| 2018 | 1,452,623 | 953,495 | 705,114 |
| 2017 | 1,380,785 | 964,067 | 650,459 |
| 2016 | 1,391,590 | 984,274 | 482,951 |
| 2015 | 1,308,214 | 871,522 | 591,072 |
- See the NWSA Container Volume History (Excel Spreadsheet)


